Honeywell Event Study
Yesterday, Honeywell released its quarterly earnings report. The stock price also tanked. Are those two items related? What is the influence of the overall market movement? Are there certain typical stock price trends around the release of earnings, and can those trends be exploited?
The quantitative finance community has a methodology (called Cumulative Abnormal Return, or CAR) that may be useful in answering those questions. The return of a stock (from day to day) can be decomposed into market and idiosyncratic components: r_t = alpha + beta * r_market_t + eta_t . r_t is the return of the stock at time t, alpha is the long-term idiosyncratic return, r_market_t is the return of the market at time t, beta is the correlation of the stock with the market, and eta_t is the abnormal return at time t.
Under normal circumstances, eta_t is zero. During some event, this abnormal return may vary. In particular, we are looking for the accumulation of eta_t (CAR) during a particular time frame. It makes sense to consider time before the event as well as after the event. The eta_t can be calculated by: eta_t = r_t - (alpha + beta*r_market_t). In other words, it is the actual returns minus the returns that the model predicts. Alpha and beta can be determined by choosing a period before the event time frame (called the "estimation period"), and regressing the actual returns against the market returns.
So, I grabbed the daily stock price from Yahoo for the time period from the beginning of 2000 to yesterday (I did this analysis last night). I used the excellent IBES/WRDS database to look up the quarterly reporting dates for that time period, as well as the reported EPS results. Then, because there were quite a number of "earnings events", I wrote a little macro to do much of the analysis.
Some details: I used the S&P500 as the market, and looked at daily returns (appropriate for this kind of event). I picked an event horizon of -20 days to +25 days, and an estimation period of 35 days prior to the beginning of the event. (It would have been nice to use a longer estimation period, but the estimation period would have included the previous quarter's event.) I excluded a couple of events, including the 3Q of 2001 (due to 9/11) and 2Q of 2000 (because it looked weird, maybe due to the GE merger thing). The graphs of each of the past 18 quarterly reports can be seen below.
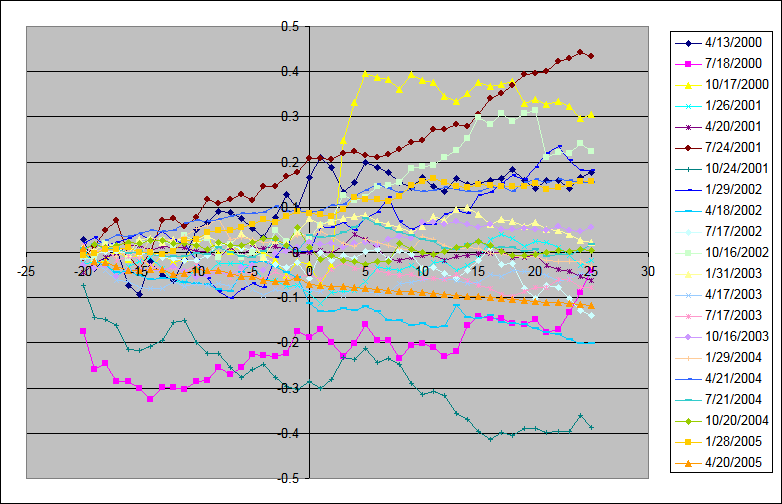
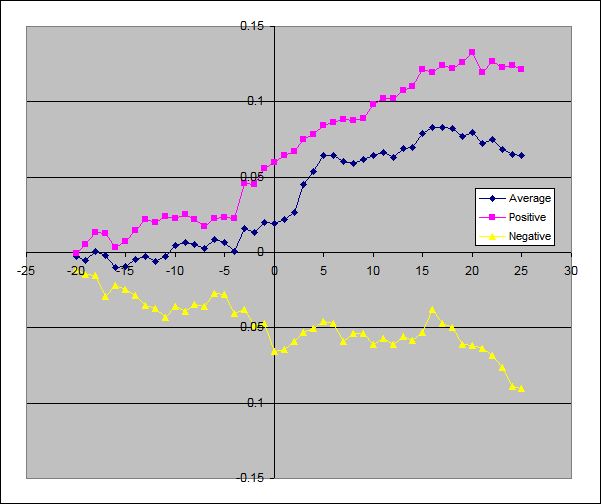
There is a lot of noise in those, though, and it is difficult to see trends. The worksheet "analysis" averages the CARs over all of the events. Also, I tried grouping the series into the set that had positive returns on the event day and a set that had negative returns on the event day. There are a couple of interesting things in the graph: First, it seems like there is a drift in the returns before the event, generally upward in cases with positive events and generally downward in cases with negative events. This is probably not tradable, for obvious reasons. Second, there seems to be strong movement after the announcement. Good events yield maybe 5% returns over 15-20 days (post-event), while bad events lose maybe 3% over 15-20 days (post-event). (Unfortunately, I don't know of a good way of quantifying the errors in those numbers.) Both of these effects are somewhat typical for earnings announcement events.
Historical performance does not guarantee future results. This is intended for amusement reasons only. Heck, the stock is up 2.5% today (although that has a lot to do with the overall market, as it translates into only a quarter of a point of abnormal return).
Comments
I guess we all need a way to entertain ourselves, don't we Jeff? Actually I found this quite interesting and I am curious what my favourite company -- BPplc -- would look like. I wonder if you should add a term for the r_t_c to include the return on crude oil for the time. My intuitive sense is that BP always rises before it's quarterly reporting and then drops afterwards no matter what the "message" in the quarter; good, bad or indifferent. But what's intuition compared to real data! Now that you have the macros written this shouldn't take too long. Just skip the results for "American Idol" tonight!
Posted by: Tom Standing | May 4, 2005 12:32 PM